Digging Deeper Into Minecraft Block Lookup Performance
I recently read a blog post by Madeline Miller about the performance of block lookups in Minecraft and how it's got worse on modern servers. The numbers made sense to me, we all know Minecraft has got slower since the good ol' days, and blocks are kind of the entire game, so it seems reasonable they'd be slower too. But taking a closer look at the numbers made me curious, why was the gap between doing 1 lookup and doing 50 lookups getting bigger? Why isn't it a linear correlation with the amount of lookups? So I decided to spend a few hours going down a rabbit hole trying to figure this out.
Rerunning the benchmarks
The benchmark itself is quite long, you can view the full thing in a gist here, but for some context, this is the "multiple" benchmark:
    public static int runBenchmark1(World world) {
        Chunk testChunks = world.getSpawnLocation().getChunk();

        int counter = 0;

        for (int i = 0; i < BLOCK_ITERATIONS; i++) {
            int x = ThreadLocalRandom.current().nextInt(16);
            int y = ThreadLocalRandom.current().nextInt(128);
            int z = ThreadLocalRandom.current().nextInt(16);

            for (int j = 0; j < TYPE_ITERATIONS; j++) {
                Material type = testChunks.getBlock(x, y, z).getType();
                if (type == lookupArray[j]) {
                    // Do 'something' so the JVM doesn't optimise this out. We're running this on a server so can't use JMH tricks etc
                    counter++;
                }
            }
        }

        return counter;
    }
The "reuse" benchmark is the same, but with the getType call moved above the TYPE_ITERATIONS loop. These are the raw numbers from Maddy's post (lower duration is better):
| Version | Multiple (ns) | Reuse (ns) |
|---|---|---|
| 1.8.8 | 336190 | 30190 |
| 1.12.2 | 529220 | 34520 |
| 1.16.5 | 684900 | 50320 |
| 1.21.4 | 1936920 | 63560 |
These numbers are very interesting, in the best case 1.21.4 is over twice as slow as 1.8.8, but in the worst case its nearly six times worse. I'm not expecting to be able to match these numbers exactly, but I would generally expect them to be similar. She ran this benchmark on a Ryzen 5950x, I'm running it on a Ryzen 7840HS, so based on the hardware, my guess is we'll see almost the same ratio between the results, but my numbers will likely be slower.
The benchmark is included in a gist, however there isn't much information on exactly how the benchmark was ran. To save myself the effort of running it manually, I'm going to tweak the benchmark to run in onEnable, and shut down the server immediately after. This is the script I'm using to run the server:
#!/bin/bash
VERSION=$1

./gradlew build
mv build/libs/blockbenchmark-1.0.jar server/plugins/.

cd server
rm -rf world*
java -Xmx16G -Xms16G -jar jars/paper-${VERSION}.jar nogui
cd -| Version | Multiple (ns) | Reuse (ns) |
|---|---|---|
| 1.8.8 | 817063 | 139630 |
| 1.12.2 | 674507 | 105831 |
| 1.21.4 | 1049302 | 112948 |
These numbers paint a much less clear picture, 1.12.2 is actually better than 1.8.9? 1.21.4 is better than 1.8.9 but only in one benchmark? We need to know more about what's going on here. Also, if you noticed the lack of 1.16.5 results, I tried to convince Gradle to build for Java 8, and Gradle won, so 1.16.5 will not be included going forward. Before I start poking the JVM with profilers and compiler commands, lets run it again to be sure.
| Version | Multiple (ns) | Reuse (ns) |
|---|---|---|
| 1.8.8 | 517928 | 86280 |
| 1.12.2 | 825091 | 98420 |
| 1.21.4 | 817873 | 142186 |
These are slightly closer to Maddy's numbers but still very inconsistent and hard to draw any conclusions from.
Taking a closer look
This is the actual measurement code in the benchmark:
        for (int i = 0; i < WARMUP_ITERATIONS; i++) {
            runBenchmark1(world);
            runBenchmark2(world);
        }

        // Keep the counter despite it being useless, so the JVM doesn't think all of this is useless
        int counter1 = 0, counter2 = 0;
        long duration1 = 0L, duration2 = 0L;

        // Run the benchmarks
        for (int i = 0; i < TEST_ITERATIONS; i++) {
            long start1 = System.nanoTime();
            counter1 += runBenchmark1(world);
            long end1 = System.nanoTime();
            duration1 += end1 - start1;

            long start2 = System.nanoTime();
            counter2 += runBenchmark2(world);
            long end2 = System.nanoTime();
            duration2 += end2 - start2;
        }
We do some warmup iterations that are ignored, then do some more iterations that we actually measure. This is pretty much how all good benchmarks are done, if you use a benchmark harness like JMH, this will be done automatically for you. There's lots of reasons for doing warmup iterations, but as the JVM uses a tiered Just In Time compiler, one of the biggest reasons for doing warmup iterations is that to make sure you're measuring the fully optimised version of the code. When your code will be optimised is complicated and non-deterministic, but we can just ask Java to log what the JIT is doing.
java -Xmx16G -Xms16G -XX:+UnlockDiagnosticVMOptions -XX:+LogCompilation -jar jars/paper-${VERSION}.jar noguiNow when we run the benchmark, we get a big XML file, I don't hate XML as much as most people, but I certainly don't want to dig through two and a half million lines of it. Thankfully, a tool called JITWatch exists that we can use to analyse this.
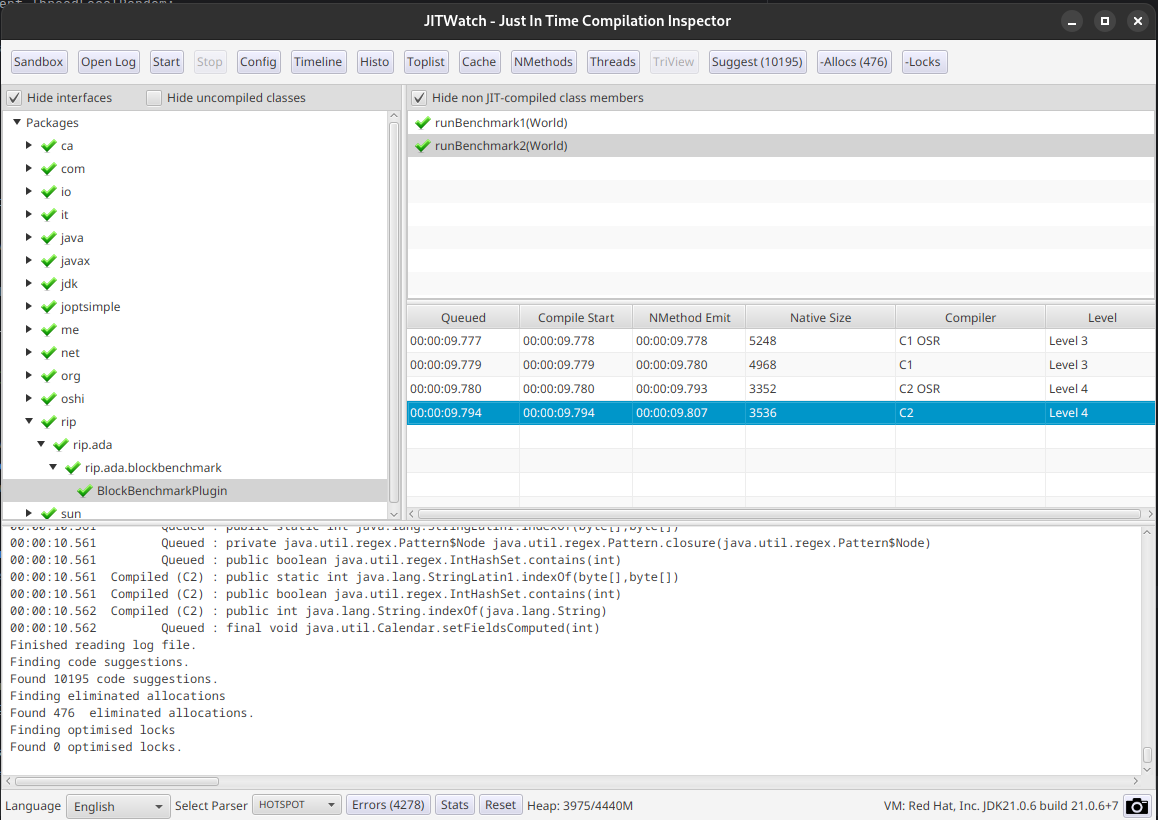
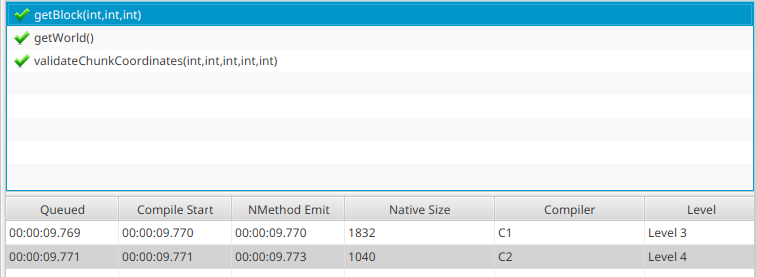
We can see the benchmark code has actually reached C2, looking at CraftChunk.getBlock also shows it has reached C2.
However the constructor of CraftBlock, the backing implementation of Block, has only reached C1.
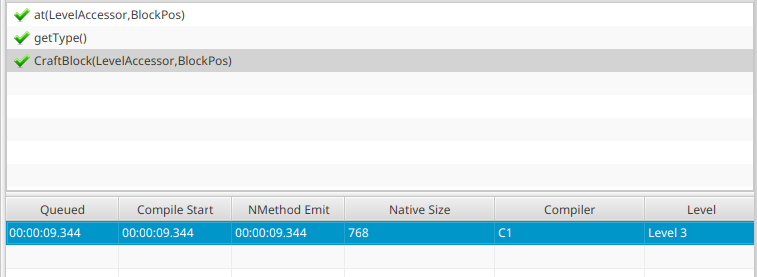
This is something I'm not 100% sure how to interpret, my first thought is that this validates the idea not everything is reaching C2. However I know the JVM will not always compile methods with C2 if it deems them trivial, however taking a look at the relevant bit of JVM code, this only seems to apply to getters and setters, so maybe it isn't trivial and should reach C2? I don't know yet.
To further the idea that this wasn't fully compiled, the timestamps on these methods are around 9.7 seconds, but the benchmark finished before the server's startup message at 9.53 seconds. There might be some delay before the server starts timing its startup, but it does seem very likely that whilst some of the code reached C2, not all of it did, and we have measured some C1 or even interpreter execution.
More iterations
There's a simple enough solution here, more warmup iterations. Trying to guess exactly how many we need is a bad idea, but we can check the thresholds used by the JVM.
ada@framework:~/IdeaProjects/blockbenchmark$ java -XX:+PrintFlagsFinal -version | grep CompileThreshold
     intx CompileThreshold                         = 10000                                  {pd product} {default}
   double CompileThresholdScaling                  = 1.000000                                  {product} {default}
    uintx IncreaseFirstTierCompileThresholdAt      = 50                                        {product} {default}
     intx Tier2CompileThreshold                    = 0                                         {product} {default}
     intx Tier3CompileThreshold                    = 2000                                      {product} {default}
     intx Tier4CompileThreshold                    = 15000                                     {product} {default}
openjdk version "21.0.6" 2025-01-21
OpenJDK Runtime Environment (Red_Hat-21.0.6.0.7-1) (build 21.0.6+7)
OpenJDK 64-Bit Server VM (Red_Hat-21.0.6.0.7-1) (build 21.0.6+7, mixed mode, sharing)
```
So in theory 15000 invocations is enough to reach Tier 4, or C2, but to be safe I'm going to change WARMUP_ITERATIONS from 10 to 10,000.
| Version | Multiple (ns) | Reuse (ns) |
|---|---|---|
| 1.8.8 | 311662 | 25157 |
| 1.12.2 | 528380 | 32719 |
| 1.21.4 | 426069 | 32279 |
These make slightly more sense, but is 1.21.4 really faster than 1.12.2? Just to be extra sure that the JIT isn't screwing with me, I'm going to increase WARMUP_ITERATIONS to 50,000 and TEST_ITERATIONS from 10 to 10,000.
| Version | Multiple (ns) | Reuse (ns) |
|---|---|---|
| 1.8.8 | 314264 | 25562 |
| 1.12.2 | 452851 | 29961 |
| 1.21.4 | 436057 | 31657 |
Other than 1.12.2 getting closer to 1.21.4, there's very little change. I'm conflicted here, if performance is actually fine, there's nothing to worry about, but then what has everyone been complaining about all these years?
How much is Paper helping?
Paper started out as a performance fork of Spigot, but these days it's by far the most popular option for servers running forks of CraftBukkit. Whilst it recently hardforked, I'm going to pretend that didn't happen and see what numbers I get on Spigot 1.21.4.
| Version | Multiple (ns) | Reuse (ns) |
|---|---|---|
| 1.21.4(paper) | 436057 | 31657 |
| 1.21.4(spigot) | 1046280 | 44492 |
Paper is a lot better, it feels odd that the Multiple case is proportionally so much worse on Spigot, but because of the comparison loop, its hard to reason about how performance should scale, so I'm willing to ignore that for now. Now that we're reliably able to get the same numbers, let's stick a profiler on it and see what happens. I'm personally a fan of async-profiler, although any random profiler is probably good enough here. Async-profiler is a JVMTI agent, so it's easy enough to get the JVM to load it at startup, along with a couple arguments to tell it what to profile and where to output its flamegraph.
java -Xmx16G -Xms16G -agentpath:../async-profiler/lib/libasyncProfiler.so=start,event=cpu,file=profile.html -XX:+UnlockDiagnosticVMOptions -XX:+LogCompilation -jar jars/paper-${VERSION}.jar nogui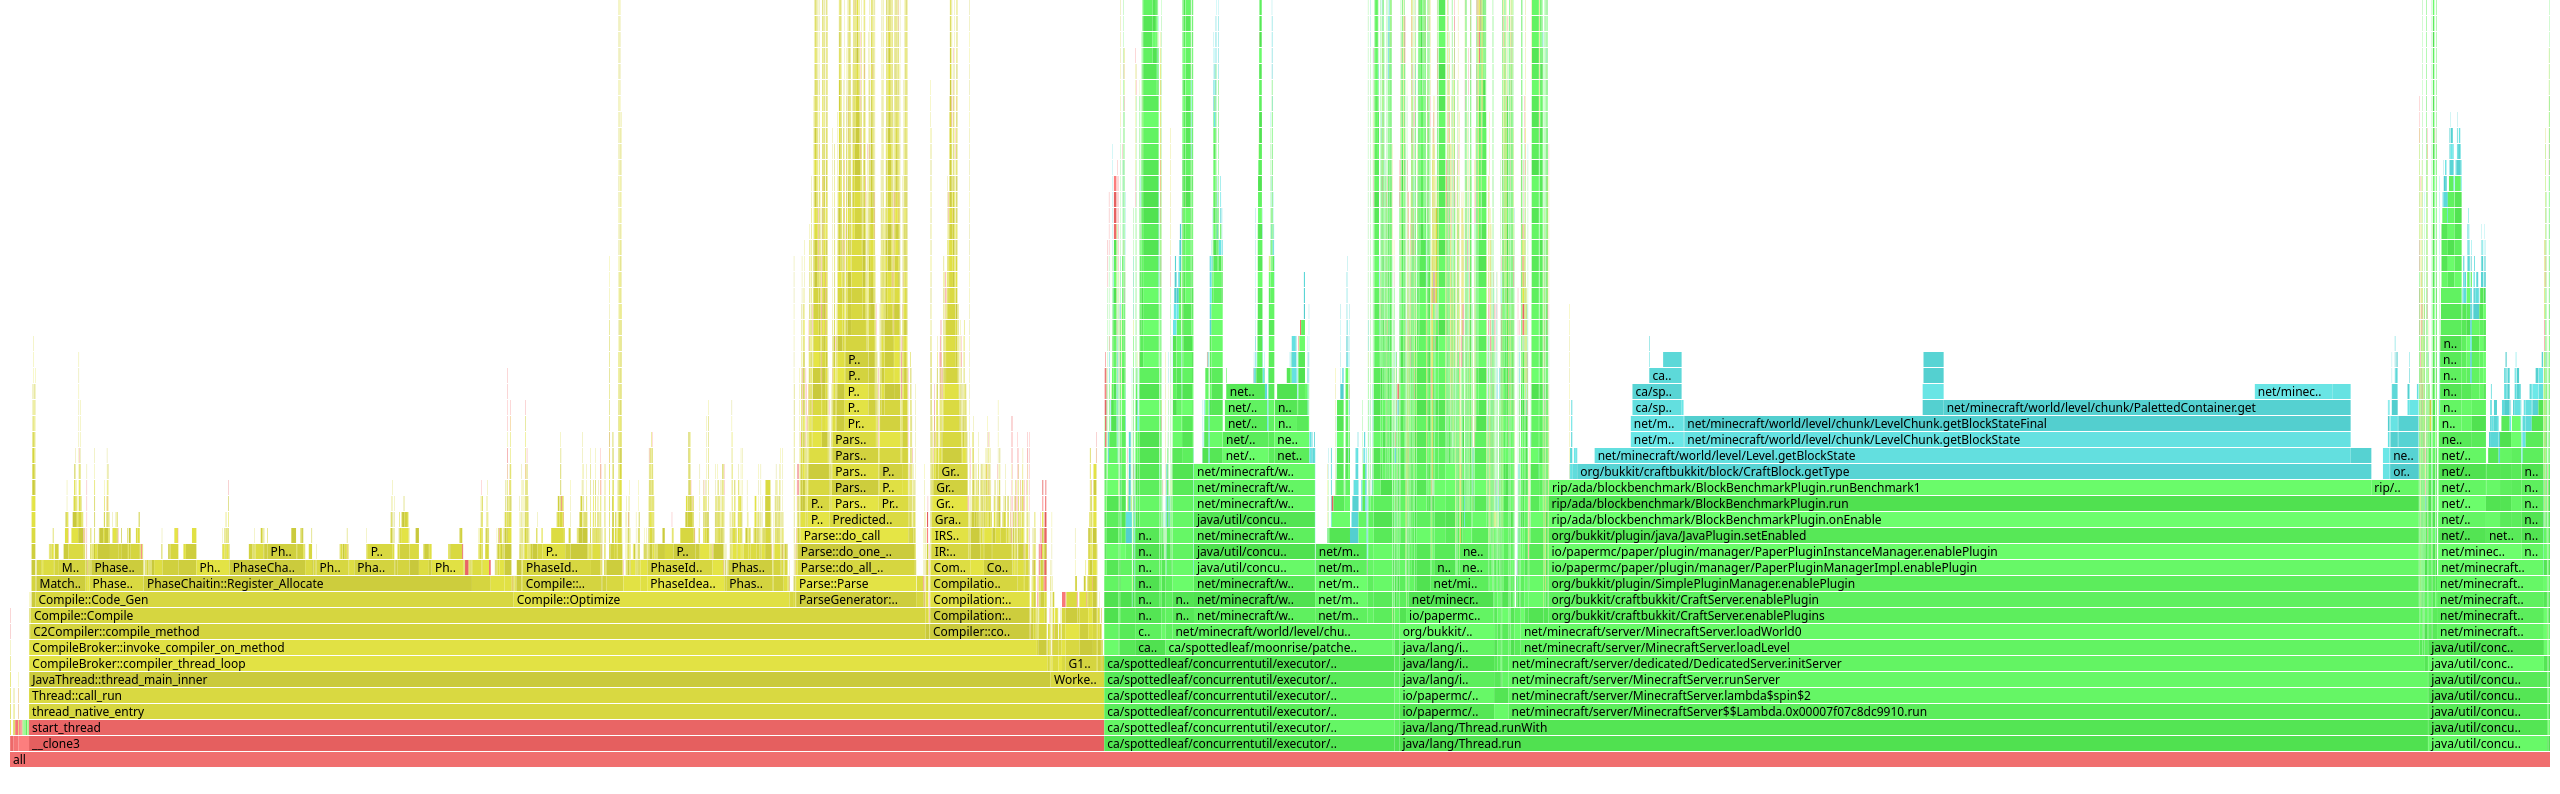
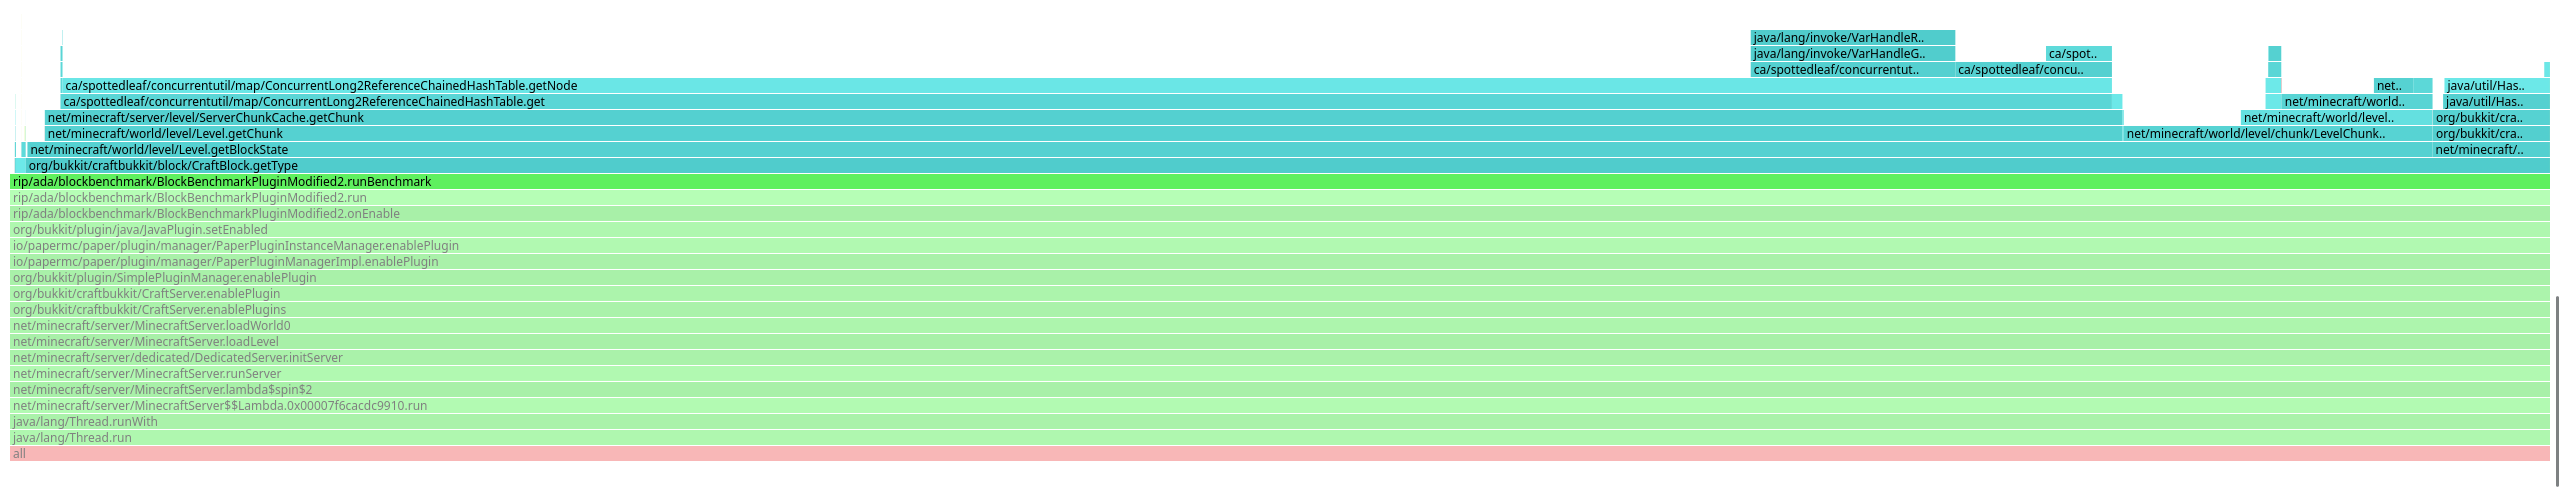
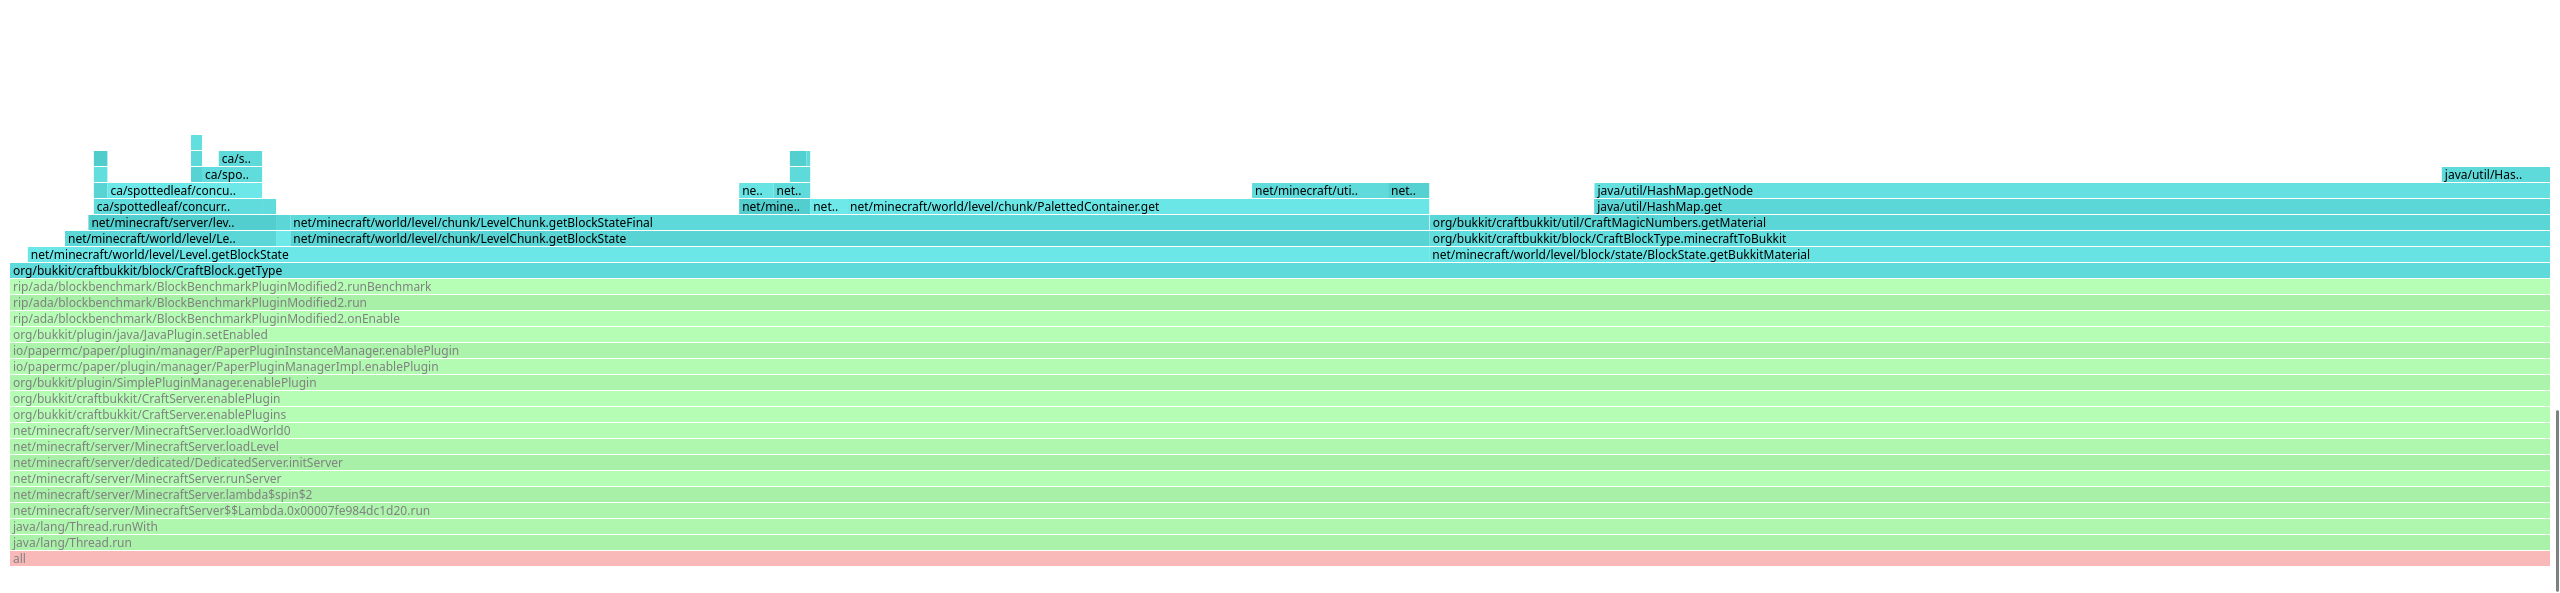
We get this flamegraph, there's a lot we're not interested in, but our benchmark is the second biggest block, so lets zoom in on that.
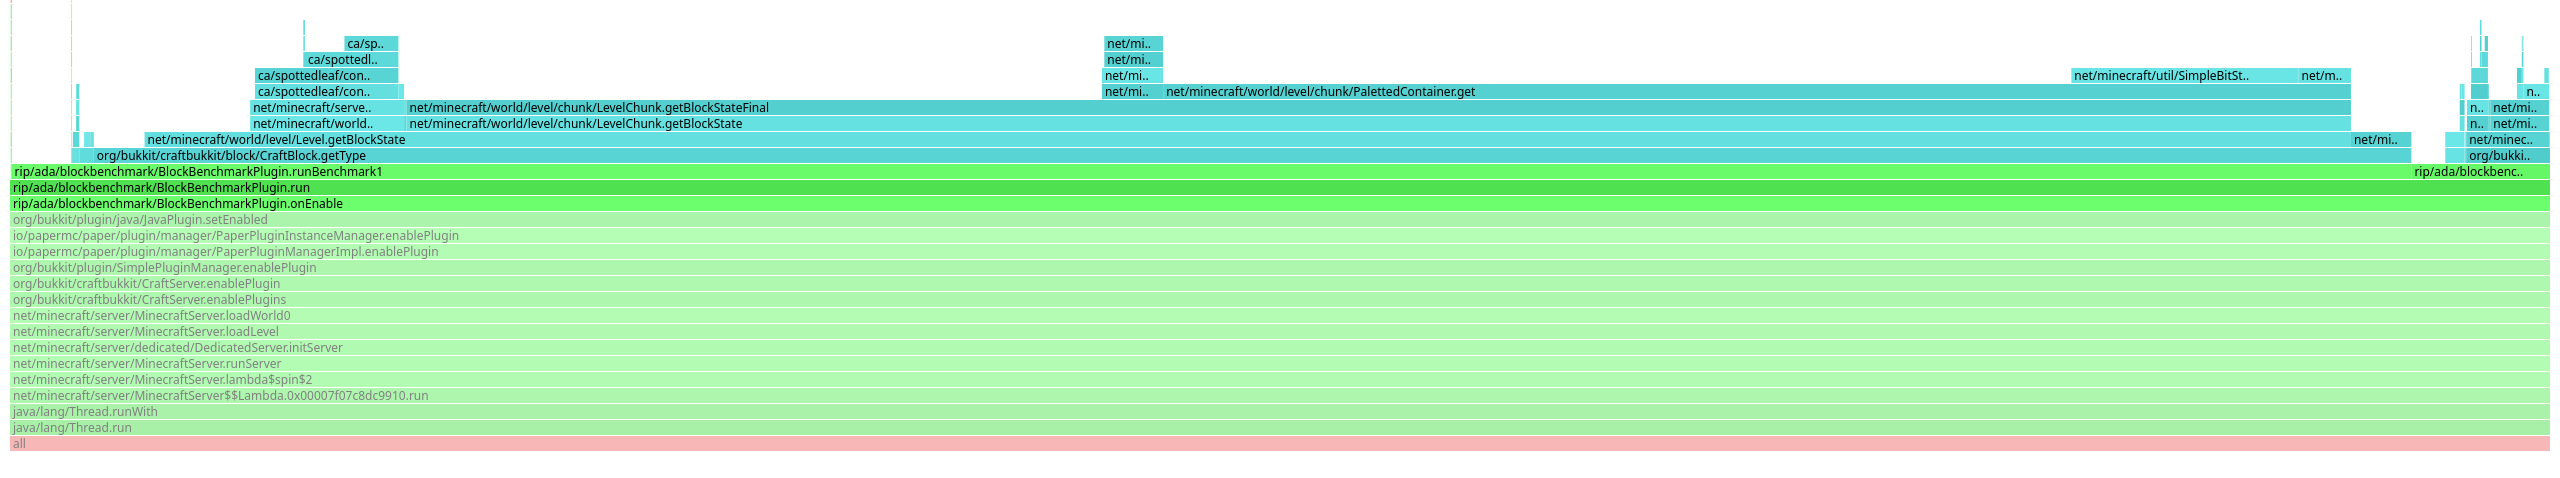
Most of the time is taken up by runBenchmark1, which calls getBlockState, which called PalettedContainer.get, that all seems fairly reasonable. So what does spigot do differently?
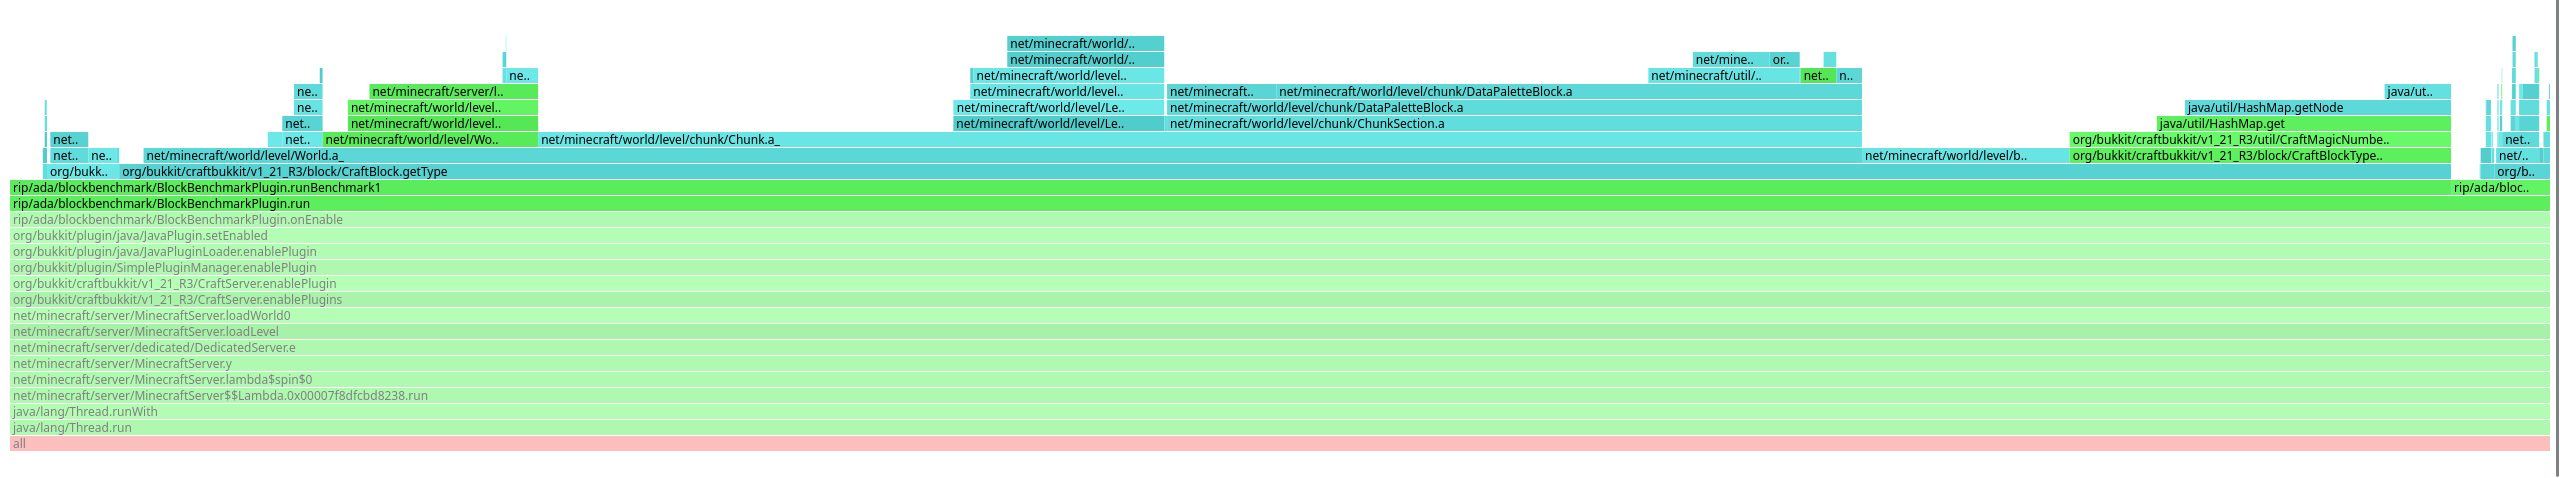
So there's a few differences here. The most visually obvious is the colours, normal Java methods are green, inlined methods are blue. Paper's flamegraph shows its entirely inlined, whereas Spigot's shows a bunch of methods that aren't. There's a lot of ways this could be interpreted, optimistically, Paper has improved the code in this area enough that it can all be inlined. Pessimistically, Paper has changed the code in this area in a way that means its easier for the JIT to optimise part of the benchmark away, making it not reflective of a real workload. It's hard to say which option it is, but lets checkout Paper's source and see what changes they've made.
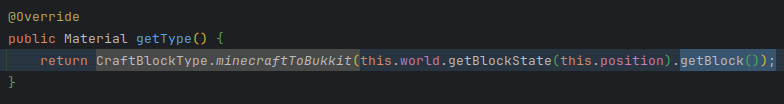
Jumping to the implementation of getType, we can see where Paper has been optimising.
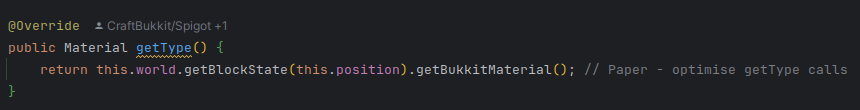
Paper has a usable git history now, so we can see what this was before the optimisation.
This tracks with what we see in the Spigot flamegraph, so what's getBukkitMaterial?
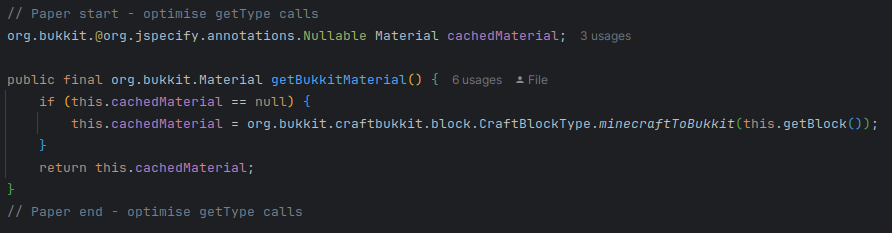
I was worried I'd see something like this. In the benchmark, we're only looking up blocks in one chunk, with tens of thousands of calls, there's no way we're ever taking the branch where it isn't cached. Without profiling a production server, I don't think its possible to know what we'd expect from this branch, but it's certainly not represented by our benchmark. To get a bit more information about what's going on, we can go back to JITWatch. Before we do that, it's worth adding another JVM option to get the optimised assembly of getType
-XX:CompileCommand=print,*CraftBlock.getType This will print the compilation to console, but also the compiler log we setup earlier. Navigating to the getType method in JITWatch, it looks like getBukkitMaterial has been inlined, but we also get a lot more information about exactly how its been inlined.
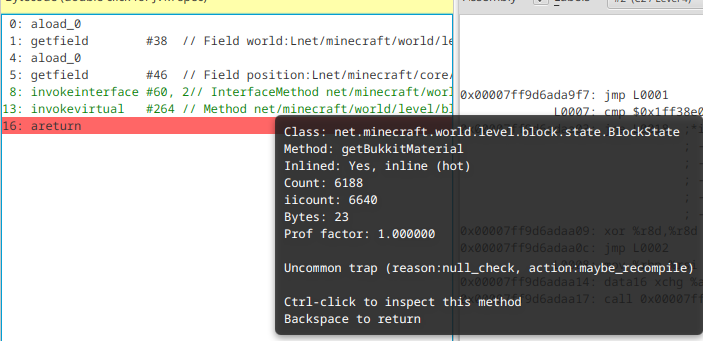
It's been inlined because its a hot method, which is fairly expected for a method being benchmarked, and it's got an uncommon trap. This is a technique the JVM uses to speculatively optimise methods when it is sure a condition is true, but it could become false in future. In this case, it's never seen the method be called with a null value, so it's better to assume it's never going to be null. In the worst case, this value does become null in future, but the JVM will just catch the fault from dereferencing the pointer and recompile the method.
Moving over to the assembly output, it's way too big to read, but if we search for cachedMaterial we can find the interesting part.
  0x00007ff9d6ada976:   mov    0x8(%r12,%rbp,8),%r11d       ; implicit exception: dispatches to 0x00007ff9d6adae7c
  0x00007ff9d6ada97b:   cmp    $0x136ec20,%r11d             ;   {metadata('net/minecraft/world/level/block/state/BlockState')}
  0x00007ff9d6ada982:   jne    0x00007ff9d6adad28
  0x00007ff9d6ada988:   shl    $0x3,%rbp                    ;*invokevirtual getBlockStateFinal {reexecute=0 rethrow=0 return_oop=0}
                                                            ; - net.minecraft.world.level.chunk.LevelChunk::getBlockState@13 (line 279)
                                                            ; - net.minecraft.world.level.Level::getBlockState@68 (line 1363)
                                                            ; - org.bukkit.craftbukkit.block.CraftBlock::getType@8 (line 229)
  0x00007ff9d6ada98c:   cmp    0x8c(%rbp),%r12d
  0x00007ff9d6ada993:   je     0x00007ff9d6adaa11           ;*synchronization entry
                                                            ; - org.bukkit.craftbukkit.block.CraftBlock::getType@-1 (line 229)
  0x00007ff9d6ada995:   mov    0x8c(%rbp),%r10d
  0x00007ff9d6ada99c:   mov    %r10,%rax
  0x00007ff9d6ada99f:   shl    $0x3,%rax                    ;*getfield cachedMaterial {reexecute=0 rethrow=0 return_oop=0}
                                                            ; - net.minecraft.world.level.block.state.BlockState::getBukkitMaterial@19 (line 20)
                                                            ; - org.bukkit.craftbukkit.block.CraftBlock::getType@13 (line 229)
  0x00007ff9d6ada9a3:   add    $0x30,%rsp
  0x00007ff9d6ada9a7:   pop    %rbp
  0x00007ff9d6ada9a8:   cmp    0x448(%r15),%rsp             ;   {poll_return}
  0x00007ff9d6ada9af:   ja     0x00007ff9d6adaea2
  0x00007ff9d6ada9b5:   ret
This is just after a call to getBlockState. The first 3 instructions are a check that the class is actually BlockState, if not it will jump to code that can handle doing a checkcast. Then it does cmp 0x8c(%rbp),%r12d, this seems to be the null check as following the je instruction goes to an inlined version of getBukkitMaterial. If we don't take the jump, the pointer is non null, so we copy the lower 32 bits of it, then do shl $0x3,%rax to decompress the pointer. Finally there's a safepoint check, and then the pointer to a Material is returned.
Making the benchmark more realistic
Whilst the JVM has done a very good job of optimising the best case for caching materials, the real world isn't going to be as simple. I see two options for avoiding the cache - using more chunks, or just disabling the cache. More chunks is probably the most realistic option, but it's going to be significantly more complicated to benchmark. As for disabling the cache, I already have Paper checked out locally so it shouldn't be too hard to build. To be sure there's no other factors at play, I've checked out the commit of Paper that I was using for 1.21.4 previously (73f7736e). And because performance is weird, I'm going to run the benchmark on the unmodified jar from this gradle build to be sure there's no surprises.
| Version | Multiple (ns) | Reuse (ns) |
|---|---|---|
| 1.21.4(paper) | 436057 | 31657 |
| 1.21.4(paper, git) | 438299 | 34159 |
The number from the git version are slightly worse but within margin of error. Let's make that change and see what we get
    public final org.bukkit.Material getBukkitMaterial() {
        return org.bukkit.craftbukkit.block.CraftBlockType.minecraftToBukkit(this.getBlock());
        // if (this.cachedMaterial == null) {
        //     this.cachedMaterial = org.bukkit.craftbukkit.block.CraftBlockType.minecraftToBukkit(this.getBlock());
        // }
        // return this.cachedMaterial;
}| Version | Multiple (ns) | Reuse (ns) |
|---|---|---|
| 1.8.8 | 314264 | 25562 |
| 1.12.2 | 452851 | 29961 |
| 1.21.4(paper) | 436057 | 31657 |
| 1.21.4(paper, no block type cache) | 590588 | 36523 |
| 1.21.4(spigot) | 1046280 | 44492 |
So, what do these numbers actually tell us? If we're looking up blocks that haven't changed since they were last looked up, 1.21.4 is within margin of error of 1.12.2 but noticeably slower than 1.8.8. In the worst case, uncached lookups on 1.21.4 are significantly slower than 1.12.2 or 1.8.8, however they're still much faster than plain Spigot, so the Paper optimizations are still helping us.
Performance Models
The original goal of Maddy's benchmark was to show that if you can, you should avoid looking up a block multiple times. This is good advice, but it's also measuring something very specific - the gap between 50,000 lookups + 50,000 comparisons and 1,000 lookups and 50,000 comparisons, in the spawn chunk, with blocks that are not changing, accessed from the main thread, on a given build of Paper. Change any one of those factors and the numbers could be entirely different, and it's very likely those factors will differ wildly between plugins and servers, something like WorldGuard is likely to be mostly dealing with blocks that stay the same, so it will benefit from Paper's material caching, but for minigame plugins like spleef, it's possible it will never hit that cache.
If we want a better idea of how long block lookups themselves take, we'll need to change the benchmark a bit, and the JIT backs us into a corner a bit here. In the previous benchmark, we were comparing the block type, in this one, we don't want to do anything with it. If we just look it up and discard the result, the JIT will notice we don't use it and optimise our benchmark away. This is why having JMH is very handy, it will give us a blackhole that we can send objects to, which tricks the JIT into thinking the object is being used.
Blackholes
JMH's Blackhole implementation is complicated, and you need to be very careful in how you set it up (I once got asked what JMH's blackhole password was in an interview, still not happy about that). In newer JVM's, the complexity is reduced significantly by compiler blackholes, this allows us to use a command line argument to designate one of our own methods as a blackhole, this means the JIT cannot optimise away any arguments passed to it. Using a blackhole instead of comparisons, our code now looks like this:
    public static void runBenchmark() {
        for (int i = 0; i < BLOCK_ITERATIONS * TYPE_ITERATIONS; i++) {
            int x = random.nextInt(16);
            int y = random.nextInt(128);
            int z = random.nextInt(16);

            final Material type = testChunks.getBlock(x, y, z).getType();
            blackhole(type);
        }
    }

    private static void blackhole(final Object object) {
    }
There's no need for two benchmarks now, so we'll simplify it down to one, but we'll keep the iteration count the same for consistency. To enable this blackhole, we need to add another argument to the JVM: -XX:CompileCommand=blackhole,*BlockBenchmarkPlugin.blackhole. Now let's run this on the different server versions and see what happens.
| Version | Duration (ns) |
|---|---|
| 1.8.8 | 570104 |
| 1.12.2 | 777777 |
| 1.21.4 (block cache) | 736972 |
| 1.21.4 (no block cache) | 959850 |
| 1.21.4 (spigot) | 1527763 |
It got worse??? Let's stick a profiler on it and see where the time is going.
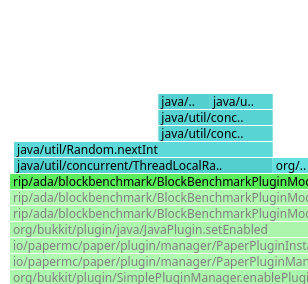
Whilst its not the majority of the graph, Random.nextInt is taking up about 10% of the benchmark runtime. Lets rearrange the loops to be more similar to the earlier benchmark and see what we get.
    public static void runBenchmark() {
        for (int i = 0; i < BLOCK_ITERATIONS; i++) {
            int x = random.nextInt(16);
            int y = random.nextInt(128);
            int z = random.nextInt(16);

            for (int j = 0; j < TYPE_ITERATIONS; j++) {
                final Material type = testChunks.getBlock(x, y, z).getType();
                blackhole(type);
            }
        }
    }
We're reducing our calls to random to only happen 1 in every 50 block lookups, which should make them less of a problem.
| Version | Duration (ns) |
|---|---|
| 1.8.8 | 326814 |
| 1.12.2 | 455798 |
| 1.21.4 (block cache) | 417515 |
| 1.21.4 (no block cache) | 557407 |
| 1.21.4 (spigot) | 853065 |
This is odd, the random number generation was taking ~10% of the benchmark runtime, we reduce only that by a factor of 50, and the whole benchmark is nearly twice as fast. I'm suspicious of this being caused by some kind of cache related effected. We can check this with perf, a profiler built in to the kernel that exposes numerous performance counters to diagnose problems like this, the output would be far too big if all were included so I'm just going to include high level numbers about cache misses and branch predictor misses.
The command line for this is perf stat -e cycles,instructions,cache-references,cache-misses,branches,branch-misses. I'm going to run this using the version without material caching.
In the fast version that randomises every 50 lookups we get this from perf:
         120,498.64 msec task-clock                       #    1.300 CPUs utilized
               97,018      context-switches                 #  805.138 /sec
                6,847      cpu-migrations                   #   56.822 /sec
              516,148      page-faults                      #    4.283 K/sec
      574,031,350,386      cycles                           #    4.764 GHz
       39,076,701,587      stalled-cycles-frontend          #    6.81% frontend cycles idle
    1,532,942,310,768      instructions                     #    2.67  insn per cycle
                                                     #    0.03  stalled cycles per insn
      224,867,904,512      branches                         #    1.866 G/sec
        1,273,833,958      branch-misses                    #    0.57% of all branches
In the slow version that randomises every lookup we get this from perf:
        192,731.13 msec task-clock                       #    1.167 CPUs utilized
            107,087      context-switches                 #  555.629 /sec
              7,811      cpu-migrations                   #   40.528 /sec
            512,915      page-faults                      #    2.661 K/sec
    921,946,797,824      cycles                           #    4.784 GHz
     67,175,724,282      stalled-cycles-frontend          #    7.29% frontend cycles idle
  2,213,052,683,957      instructions                     #    2.40  insn per cycle
                                                   #    0.03  stalled cycles per insn
    239,608,250,126      branches                         #    1.243 G/sec
      4,673,879,449      branch-misses                    #    1.95% of all branches
That's significantly more branch misses for roughly the same amount of branches, but where are these branch predictor misses? It's possible this is a red herring from calling random more often if all the misses are actually there. Now that we know branch misses increased, we can get async-profiler to give us a flamegraph of where those branch misses are.
These flamegraphs are zoomed in on our benchmark, so they appear the same length, but the slow version actually has 1.25 million branch predictor misses in the benchmark method, compared to the fast version's 48 thousand. This is a long way off the 3.5 billion difference we saw running perf directly, and the flamegraphs seem to capture a lot less branch predictor misses (1.7 million in the slow version vs 513 thousand in the fast version), but I'm willing to attribute the difference to the tools and the other threads as C2 makes up the majority of branch predictor misses in the fast case.
Taking a look at the fast case, we see the majority of the branch predictor misses are in ConcurrentLong2ReferenceChainedHashTable, and the rest are in getBlockState, with relatively few in getBukkitMaterial. The slow case is very different, we see around half a million misses in nextInt, along with 300 thousand in getBlockStateFinal, and 200 thousand in getBukkitMaterial. I think this actually provides a lot of context for how this method performs. If we're querying the same block repeatedly, it's very fast in part because the CPU is able to predict everything, but as soon as it becomes unpredictable, performance degrades significantly.
Which is a better representation of how this method performs? I'm not sure, neither feel like particularly realistic workloads, you're probably never going to be looking up the same block 50 times in quick succession, but it also seems unlikely that every block would be entirely random. For completeness, I did another test where the Y coordinate was between 128-256 (rather than 0-128), so the blocks would be almost all air, and branch predictor misses dropped to 700 within the benchmark method. The best option I can think of here is to pre generate some coordinates and loop over those, rather than randomly generating it each time. This would ensure we're not just accessing the exact same block every time, whilst avoiding any effects from generating random numbers every time.
Our new benchmark looks like this:
    private static Chunk testChunks;
    private static int[] xCoords = new int[50];
    private static int[] yCoords = new int[50];
    private static int[] zCoords = new int[50];


    @Override
    public void onEnable() {
        ThreadLocalRandom random = ThreadLocalRandom.current();
        for (int i = 0; i < 50; i++) {
            xCoords[i] = random.nextInt(16);
            yCoords[i] = random.nextInt(128);
            zCoords[i] = random.nextInt(16);
        }
        this.run();
        Bukkit.shutdown();
    }

    public static void runBenchmark() {
        for (int i = 0; i < BLOCK_ITERATIONS; i++) {
            for (int j = 0; j < TYPE_ITERATIONS; j++) {
                final Material type = testChunks.getBlock(xCoords[j], yCoords[j], zCoords[j]).getType();
                blackhole(type);
            }
        }
    }
And the results are:
| Version | Duration (ns) (coord array) |
Branch predictor misses | Duration (ns) (slow case) |
Duration (ns) (fast case) |
|---|---|---|---|---|
| 1.8.8 | 332178 | 261 | 570104 | 326814 |
| 1.12.2 | 541140 | 336 | 777777 | 455798 |
| 1.21.4 (block cache) | 445493 | 304 | 736972 | 417515 |
| 1.21.4 (no block cache) | 580327 | 417 | 959850 | 557407 |
| 1.21.4 (spigot) | 1031262 | 5021 | 1527763 | 853065 |
It seems like theres a lot less branch predictor misses even compared to the fast case, my first question is if the array is too small to hide the effects of caching, the amount of branch predictor misses does increase but even with an array of 50 thousand elements, it doesn't reach the 48 thousand branch predictor misses we were seeing in the "fast case".
I think these numbers are slightly more reliable now that we've eliminated the randomness, but there's still a few things I'd like to clean up.
Coordinated Omission
This is a pretty irrelevant problem because the benchmark is single threaded, but I think it's a good opportunity to demonstrate it, and I find it interesting, so I'm going to infodump about it anyway. So far all the benchmark numbers have been a relatively abstract duration, I'm going to switch to throughput (ops/second) from this point, where one op is a call to getBlock, then getType, then blackholing it. For reference, these are the numbers from the coordinate array benchmark in ops/second:
| Version | ops/second |
|---|---|
| 1.8.8 | 150,521,708 |
| 1.12.2 | 92,397,531 |
| 1.21.4 (block cache) | 112,235,209 |
| 1.21.4 (no block cache) | 86,158,321 |
| 1.21.4 (spigot) | 48,484,284 |
How well does getType scale when it's being called by multiple threads? This is an entirely read based workload (the block cache will be fully populated by the warmup run), so there shouldn't be contention, which means I expect it to scale fairly linearly. We can just pull the benchmark loop into a thread, start several of them, and add up the results.
public static final int THREADS = 4;
...
        final List<BenchmarkThread> threads = new ArrayList<>();
        for (int i = 0; i < THREADS; i++) {
            final BenchmarkThread benchmarkThread = new BenchmarkThread();
            benchmarkThread.start();
            threads.add(benchmarkThread);
        }

        for (final BenchmarkThread thread : threads) {
            thread.join();
            duration += thread.duration;
        }

        System.out.println("Benchmark: " + (duration / threads.size() / TEST_ITERATIONS) + "ns");
    }

    private static final class BenchmarkThread extends Thread {

        public long duration = 0;

        @Override
        public void run() {
            for (int i = 0; i < TEST_ITERATIONS; i++) {
                long start = System.nanoTime();
                runBenchmark();
                long end = System.nanoTime();
                duration += end - start;
            }
        }
    }
As with the branch predictor experiments, I'll run this on the 1.21.4 paper build without the material cache enabled. Here is the results across different thread counts:
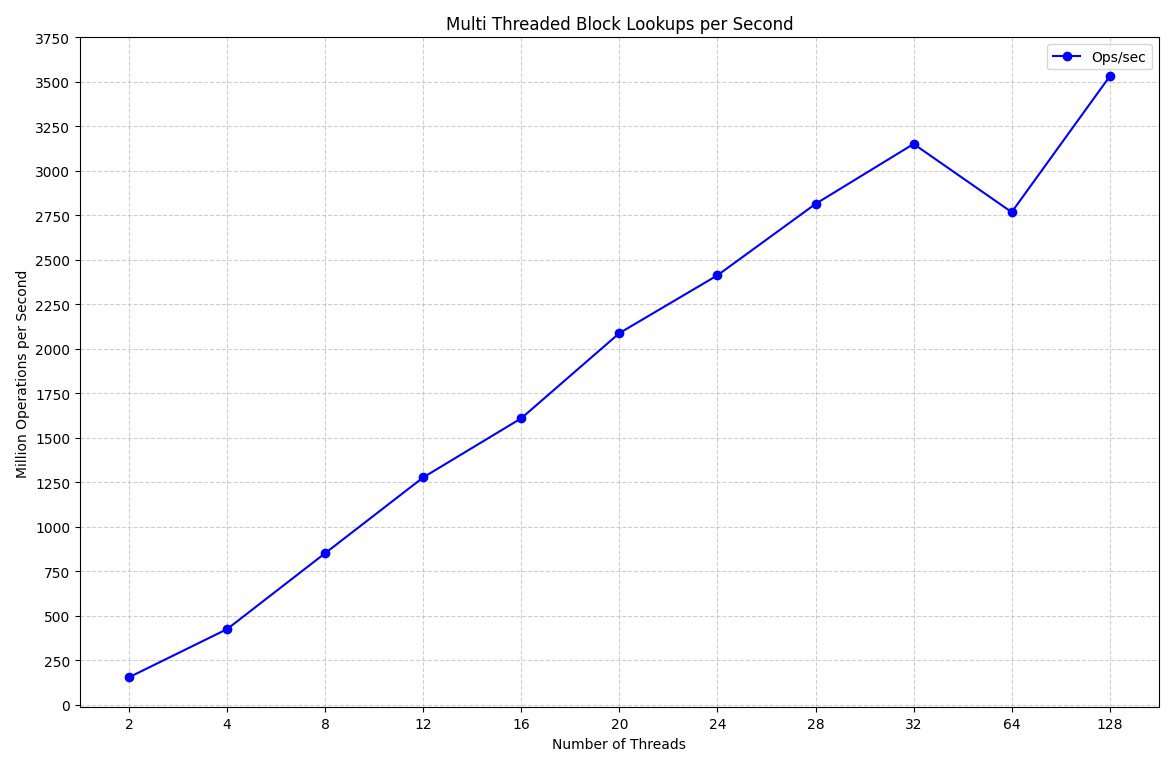
This is pretty obviously wrong, my laptop has 8 cores and 16 threads, it might linearly scale up to that point, but it should at the very least stop scaling beyond 16 threads. If we take a closer look at the benchmark thread, we can start to figure out what happened.
        public void run() {
            for (int i = 0; i < TEST_ITERATIONS; i++) {
                // we get descheduled here
                long start = System.nanoTime();
                runBenchmark();
                long end = System.nanoTime();
                duration += end - start;
            }
        }
Because we're only timing runBenchmark, if we get descheduled between iterations, the lost time is not counted in the benchmark. This isn't just a scheduler thing either, you could get the same effect from a GC pause, especially if the JIT puts a safepoint into the backedge of the loop (it wouldn't here because its a counted loop). In this example, it's a pretty easy fix, we just need to time the entire duration of the thread.
        public void run() {
            long start = System.nanoTime();
            for (int i = 0; i < TEST_ITERATIONS; i++) {
                runBenchmark();
            }
            long end = System.nanoTime();
            duration += end - start;
        }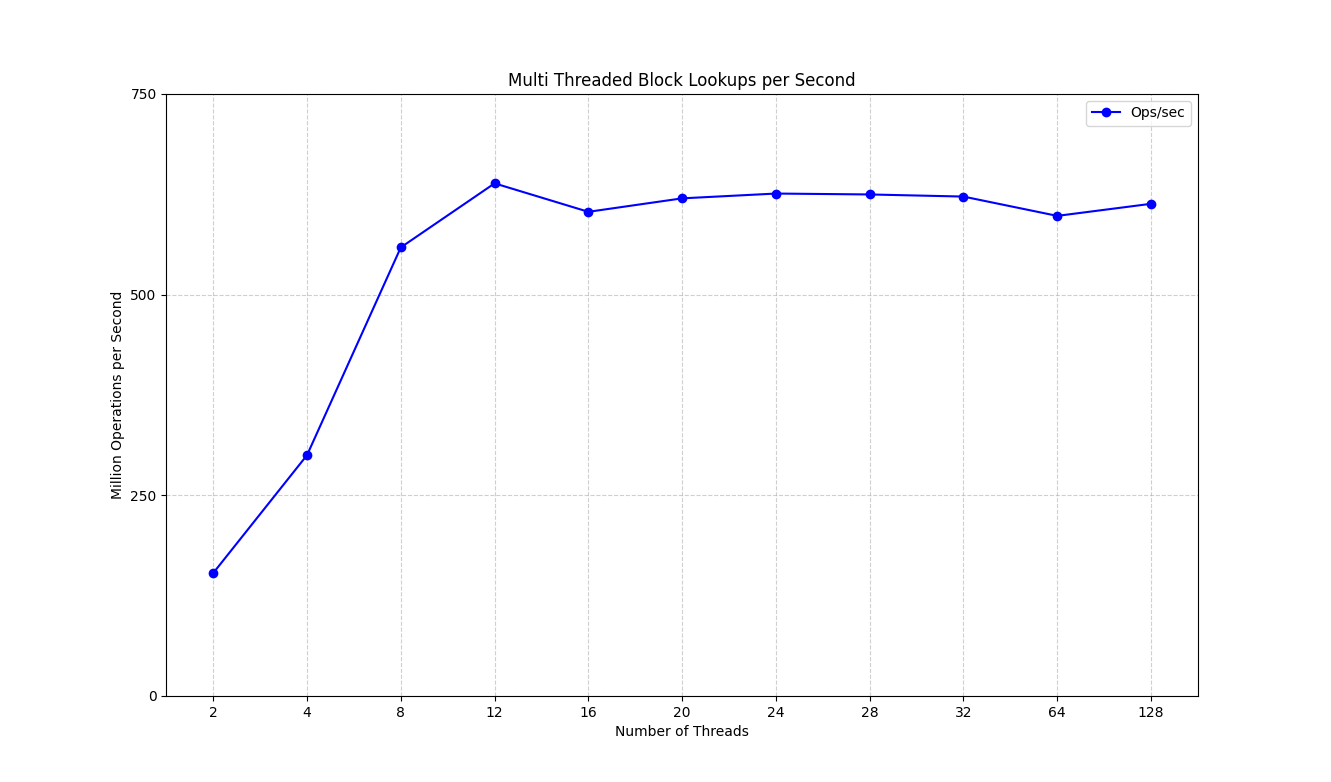
Now we see a much more realistic graph that tails off once we reach 12 threads. There's a lot more to this topic than I want to cover here, I'd recommend watching Gil Tene's talk about measuring latency. But the short version is now that we're measuring the whole runtime of each thread, we're not going to get inaccuracies from the scheduler or JVM conspiring against us. I will also add the disclaimer that the first run showing coordinated omission was done with some polite suggestions to the scheduler to emphasise the problem, in a normal run the effect here is more subtle, it seems to falsely add about 10% more throughput on my system.
Environmental Problems
I've been running this benchmark on a laptop, this is a terrible, terrible idea. I have other things running in the background, the system is completely untuned, and looks nothing like where you'd typically run a Minecraft server. I don't want to get too far into this, but here's a quick list of some reasons my laptop is a terrible benchmarking environment and you should trust none of the numbers it produces.
Core Isolation & Thread Pinning
There's loads of other processes running on my laptop, even if I close everything running, there's probably tens of processes that are still there. The scheduler is going to suspend, resume and relocate all these threads whenever is most inconvenient, and it will affect your benchmark results. This is a pretty easy fix though, Linux has a kernel parameter that allows for cores to be isolated from the scheduler to ensure nothing can run on that core, and there's a function in libc that allows us to assign threads to specific cores, along with bindings in Java that allow us to do this. This doesn't usually make a huge difference to the results themselves, but it is a big step to reducing variance.
CPU Scaling
All modern CPUs will scale their frequency to match the workload, this is great for thermals, and terrible for benchmarking. Right now some of my cores are at 1.0GHz, some are at over 4GHz, running the benchmark should cause the core it's running on to scale up, but if the CPU has turbo boost enabled or gets too hot, it might scale down at an indeterminate point during the benchmark, alternatively it might turbo boost for the entire benchmark and give you a better result you can't reproduce. Regardless of what you run in prod, disabling CPU scaling will make your benchmark more repeatable.
RAM Timings
Most Minecraft worlds aren't going to fit into an L3 cache, so there will be a lot of memory access when accessing blocks. In this specific benchmark we focused on a single chunk, so likely avoided the worst of RAM related issues (and made the benchmark too optimistic), but even if the CPU in my laptop could keep up with the single threaded performance of a 7950x, the RAM simply can't. I'm using 5600MT/s DDR5 with a CAS latency of 40, this is probably fine for a laptop, but I would expect a server to have much better timings. Again, for a single chunk that will fit in L3 cache, this is fine, but I would be skeptical of any results using a larger amount of data.
Garbage Collection
The benchmark code was ran in a real server, but a server with no players, no chunks loaded outside spawn and no plugins, this could not be further from the reality of a real server. Even worse, running the benchmark in onEnable means the main thread isn't even running. The amount of objects being allocated will be a fraction of a real world server, so GC activity will be equally minimal, Minecraft is famously terrible for allocating garbage, and the plugins are usually even worse, so GC will be a much bigger factor in the performance of a real server than this best case benchmark.
Conclusion
Benchmarking is hard, doing it without a good library is even harder, you should be skeptical of any performance claims you find online, and even more skeptical of performance claims you make yourself. Even a perfectly written benchmark is only accurate in the exact situation that it measures on the hardware it was run on, the real world will look vastly different. Unfortunately even after 15 years of the game existing, no good benchmarking tools have come out of the Minecraft modding community, and even with the amount of performance mods that are out there, I don't think I've ever seen a performance test in any of their repositories. This isn't to disparage the great work the people behind those performance mods do, but to say that we simply do not have the tools to accurately measure the performance of the game as a whole or even individual functions in it.
I'm sure someone determined enough could get JMH running in a way that allows you to reasonably test Minecraft client or server code, but that's the easy part. How do you test code that isn't usually called by plugins, like mob AI? How do you make sure network code isn't getting worse? What about the server as a whole? I'd love to see some tools emerge that allow us to answer performance questions like this, but right now there simply isn't a good way to do this.
Maddy's blog post does a very good job at giving the advice it intends to give. Are the numbers totally accurate? Probably not. Does it matter? No, I just found the numbers interesting and wanted to find out what was going on. So what can we actually say about block lookup performance? It's probably got a bit worse. How much worse? My numbers say its just under twice as slow as 1.8.9. Should this information change how you write code? Maybe, it really depends on what you're doing. Should you trust my benchmark? Absolutely not.